
Synopsis: we are archiving the city’s climate and presenting it to the community in what we believe is an accessible and easy-to-read format.
Perhaps you’ve visited the Statistics page previously. WeatherCat, the software that grabs data from the weather station, automatically generated those numbers and even uploaded them to the website.
Well, the old saying “if it’s easy, it ain’t worth doing” proved true, unfortunately. As time went on, I kept spotting more mathematical errors. Plus, the tables were not very readable. Visitors couldn’t access daily history after 60 days. Navigating the page was difficult too.
Over a month ago I began overhauling the page. This involved taking raw data directly from the database and programming complex mathematical formulas. Smoke may have occasionally emanated from the computer (not to mention my ears!).
Gotta Risk it to Get the Statistic!
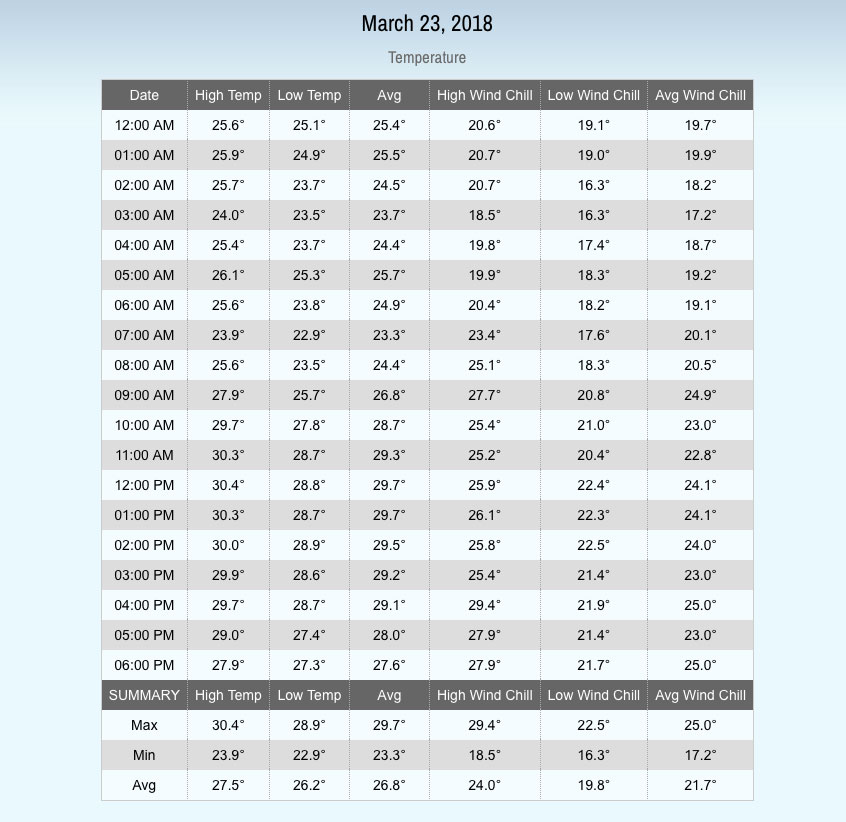 In the end, there are now a series of beautifully formatted (zebra stripped!) tables on the Stats page with contextual navigation at the top. For the visually oriented, we put 24 hours in graphs first. Immediately beneath that is the daily table listing each hour of the day. This is particularly useful on days when a front or storm is passing through and you want to see exactly how the temperature or wind changed hour by hour.
As you scroll down, you’ll notice there is a “Back to Top” link that will take you back to the top where you can access the navigation again.
The monthly and yearly sections now have selection menus where you can access past summaries.
They also have new information like the “Avg (NWS)” field. This allows for easy comparison to the NWS’ monthly climatological summaries issued at the end of the month on social media.
We now count the days certain thresholds are reached with temperatures and precipitation. If you’ve ever wondered, for instance, how many 80 degree days we had last summer or how many times it snowed over 4″ in January, you can readily access that info now.
Also, as always, we list Marquette city monthly normals near the bottom of the page (easily accessed from the top navigation).
There’s a link to our awesome forecast accuracy page followed by some notes because, believe me, this post was not long enough!