My apologies to those who endured stale data on the home page almanac & weather history page on Friday & Saturday. The app that uploads data from our weather telemetry to the website (hosted downstate) had inexplicably stopped. It wasn’t locked up. It just wasn’t running the schedule. I could manually update, but not automatically. A restart of the app solved the issue. I’ve used that utility for years now and never seen anything like that. My thanks to a regular site visitor, Julie, who alerted me and sent me a kind note to boot! Please do not hesitate to use the contact form if you notice something is awry.
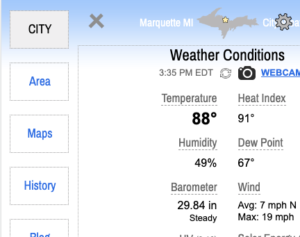
Fortunately, I have multiple, independent systems so when one fails, the others continue. For example, conditions data is uploaded every 3 seconds by two different apps. Forecasts are downloaded directly by the web server (and I can switch to a back up process when the provider is down). Even if we lose power at our property, the forecasts and alerts will continue to update indefinitely.
I am constantly checking for and fixing bugs — both in my own code and those generated by our various providers. Between our regular visitors, my wife and my own (normally) keen eye no error on the site goes undetected for long.
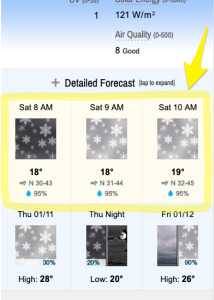
Earlier in the week you may have noticed missing forecast icons. That was due to a couple unpublished changes NOAA (parent organization to the National Weather Service) pushed out to their forecast API. Upon investigation I saw that they had started to omit the domain (!) from the image URLs. So I had to prepend the domain to all their file locations. Also they started sending an empty data field for wind direction when the speed is 0. If you know anything about programming, the first error routine is to check for empty data and reject it because all valid data must have a value. Not in this case! So I manually force a “N” (northerly) wind direction which was the default they had been supplying in that case for years. Once I realized this wasn’t just a temporary goof on NOAA’s part (which has happened multiple times and self corrects within an hour or so), I ultimately switched over to a “legacy” source for forecast data for a time until I could make updates to the affected forecast files.
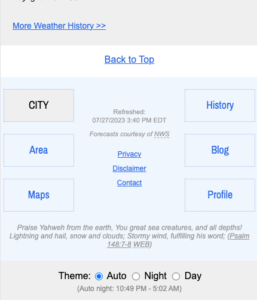
My philosophy is that the user interface — the portion of the website the visitor sees and interacts with — should be simple & dependable not trendy. No infinitely scrolling pages which stutter and lock up while you search for the information you need! No bloated multi-megabyte pages that track you and interrupt you with pop ups while you’re trying to read.
Behind the scenes of this seemingly modest (perhaps even “old-fashioned”) website are tens of thousands of lines of code written by yours truly. The weather history page alone is a complex series of mathematical calculations (using standard equations that have been accepted for decades). Everything has been quadruple checked for accuracy against other sources.
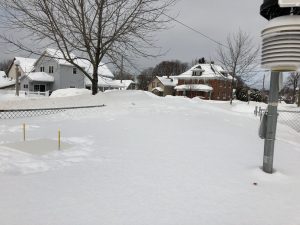
We are about to step into our 10th year of recording data just south of downtown Marquette. The aim is to provide a long-term, independent, reliable source of weather data completely free and available to the public.
Thank you to our many regular (and irregular — you know who you are) visitors!