Blog

It Ain’t Broke If You Don’t Know

My apologies to those who endured stale data on the home page almanac & weather history page on Friday & Saturday. The app that uploads data from our weather telemetry to the website (hosted downstate) had inexplicably stopped. It wasn’t locked up. It just wasn’t running the schedule. I could manually update, but not automatically. A restart of the app solved the issue. I’ve used that utility for years now and never seen anything like that. My thanks to a regular site visitor, Julie, who alerted me and sent me a kind note to boot! Please do not hesitate to use the contact form if you notice something is awry.

Fortunately, I have multiple, independent systems so when one fails, the others continue. For example, conditions data is uploaded every 3 seconds by two different apps. Forecasts are downloaded directly by the web server (and I can switch to a back up process when the provider is down). Even if we lose power at our property, the forecasts and alerts will continue to update indefinitely.

I am constantly checking for and fixing bugs — both in my own code and those generated by our various providers. Between our regular visitors, my wife and my own (normally) keen eye no error on the site goes undetected for long.

Earlier in the week you may have noticed missing forecast icons. That was due to a couple unpublished changes NOAA (parent organization to the National Weather Service) pushed out to their forecast API. Upon investigation I saw that they had started to omit the domain (!) from the image URLs. So I had to prepend the domain to all their file locations. Also they started sending an empty data field for wind direction when the speed is 0. If you know anything about programming, the first error routine is to check for empty data and reject it because all valid data must have a value. Not in this case! So I manually force a “N” (northerly) wind direction which was the default they had been supplying in that case for years. Once I realized this wasn’t just a temporary goof on NOAA’s part (which has happened multiple times and self corrects within an hour or so), I ultimately switched over to a “legacy” source for forecast data for a time until I could make updates to the affected forecast files.

My philosophy is that the user interface — the portion of the website the visitor sees and interacts with — should be simple & dependable not trendy. No infinitely scrolling pages which stutter and lock up while you search for the information you need! No bloated multi-megabyte pages that track you and interrupt you with pop ups while you’re trying to read.

Behind the scenes of this seemingly modest (perhaps even “old-fashioned”) website are tens of thousands of lines of code written by yours truly. The weather history page alone is a complex series of mathematical calculations (using standard equations that have been accepted for decades). Everything has been quadruple checked for accuracy against other sources.

We are about to step into our 10th year of recording data just south of downtown Marquette. The aim is to provide a long-term, independent, reliable source of weather data completely free and available to the public.

Thank you to our many regular (and irregular — you know who you are) visitors!

Revising Alert Policy

I normally don’t allow “Winter Weather Advisories” (WWA) to post on the City page (home page), because too often those end with unremarkable snow totals here. Also, people tune out after a certain point if they are constantly barraged with alerts, which can happen during the winter here.  When you see an alert posted on our main page, you can generally place confidence in its importance and relevance to the city.  Note that the detailed forecast will always specify accumulating precipitation within the next couple days regardless of alert status.

When I saw the Winter Weather Advisory hoisted on Friday (1/17/20), I decided to post it. I could see that just the front-end of the incoming storm was forecast to deliver 4-7″ in about 12 hours. I could also see that conditions were right for a decent amount of lake effect over the following 24 hours.  The $64,000 question, as always, was “how much?”

Continue reading “Revising Alert Policy”

Cloudy With a Chance of Old School

I have swapped out the somewhat simplistic cloud icons that previously served as a background for navigation links with hand-drawn clouds. My wife and I both feel these new icons provide more visual appeal & warmth. Then again we like anything that reminds us of a mid-century movie poster.

I’m aware that using pictures for links is considered passe by most designers now.  So-called skeumorphic interface design was popularized in early Apple products decades ago. Round about 2012 everything started going “flat”.

As for this web app, we have crowned function king. The design is largely fit to purpose with a few embellishments here & there.

Did I mention I’m not a “designer”? Oh well, add that to the list of my faults.

***

The cloud images were acquired from Iconfinder & appear courtesy of a Creative Commons license. The artist is “Azuresol”. I removed some snowflakes under them since I wanted to use them year-round. I also created a variant that is lighter. A darker icon indicates the current page while a lighter icon links to other pages.

200″ of snow in Marquette? Not even close.

You may have seen the widely circulated story that the local National Weather Service office has measured over 200 inches of snow this season as of Monday morning, February 25th. Unfortunately, some articles have explicitly assigned the total to Marquette. Others have allowed readers to conclude that this is a representative total for the area. In fact, the NWS office is located well outside of the city limits in the highlands which receive substantially more snow. 

A helpful rule of thumb is that for every 100 ft you gain in elevation, you can expect 10 additional inches of yearly snowfall.* Of course, there are other factors, such as differing lake exposure, that come into play in the wider area. For this comparison, however, elevation is the key difference. So, given that the NWS office is 800 ft higher than the lakeshore of Marquette, that represents approximately 80″ of additional snowfall per year. In fact, that’s very close to the 30 year normals. Marquette normally receives close to 120″, and Negaunee Township gets a little over 200″ per year.

So far this season (October 1 – February 25) in Marquette, the city’s official NOAA COOP weather station has recorded 96.3″. That’s less than HALF the amount the NWS office received. Just a mile away from the COOP station at our location, 3 blocks south of downtown, we recorded 108″ in that period. We are about 100 ft higher than the COOP station, which explains why we’ve had a bit more snow. To be more than fair, I would allow for an additional foot or so lost to high winds this winter at our station (which would give us about 120″).

So, in other words, both Marquette and Negaunee Twp have received something close to their normal seasonal totals thru the end of February. That would be the proper way to frame a story if, indeed, you were writing about Marquette.

Continue reading “200″ of snow in Marquette? Not even close.”

When Weather Apps Fail at Weather

I wrote about this yesterday on Twitter. Given the limitations of that platform, however, I couldn’t really go deep. Let’s dive in.

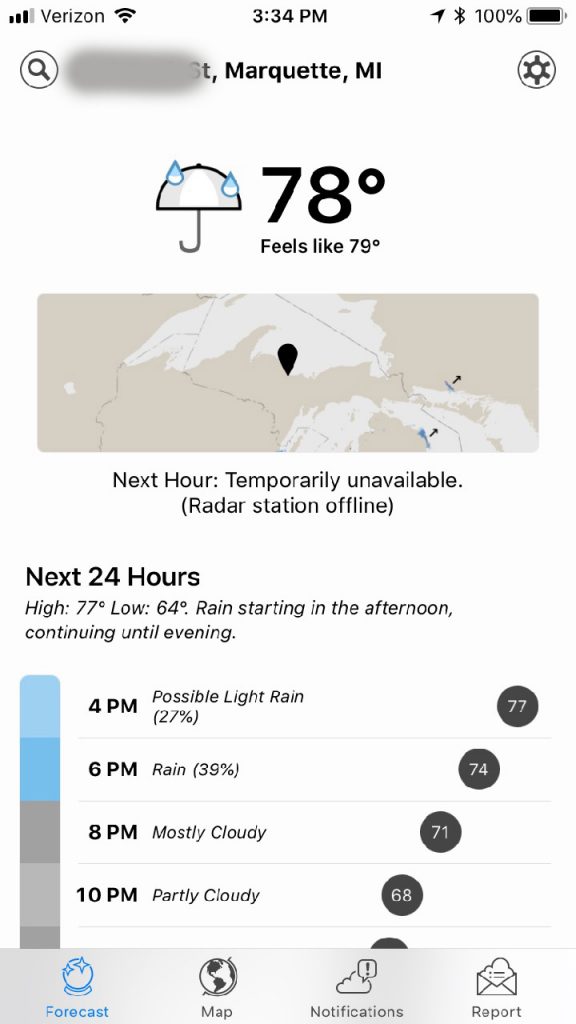
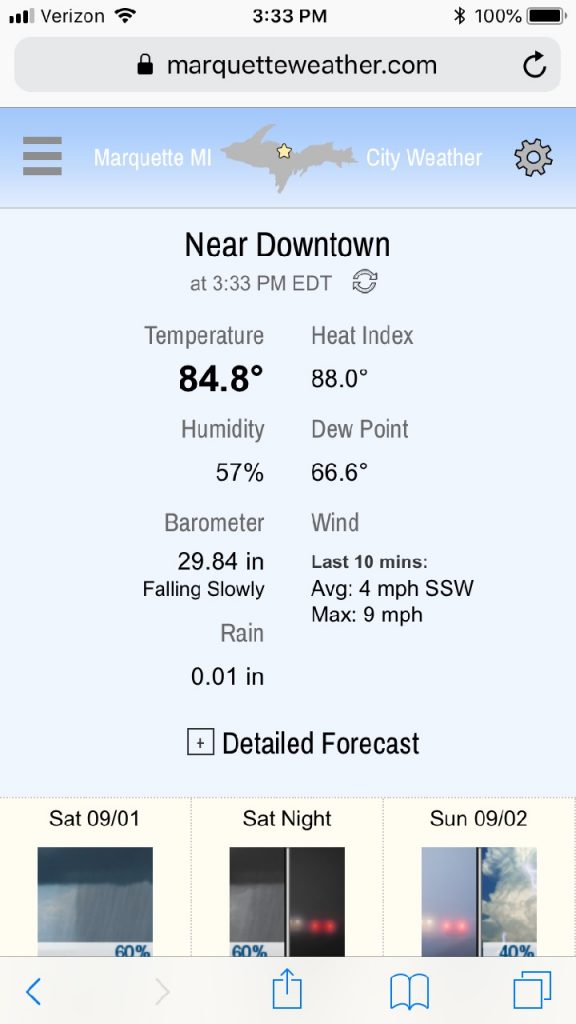
Here are two screenshots taken within 60 seconds yesterday afternoon:


The 1st image is of a popular weather app recently redesigned for the iPhone. The 2nd image is our universal web app loaded in Safari on an iPhone.*

Continue reading “When Weather Apps Fail at Weather”

Back to Top
Theme:

(Auto night: 10:49 PM - 5:02 AM)