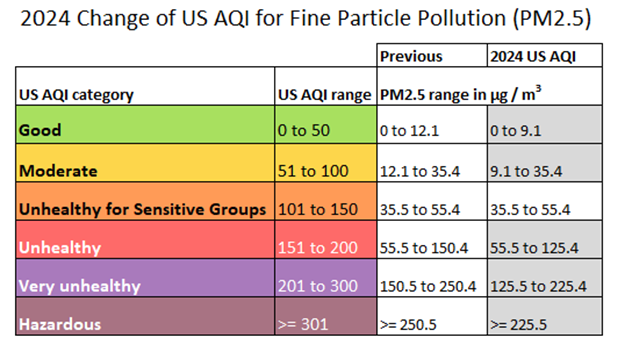
Blog

Real-time Air Quality Monitoring Now Available

We have acquired & installed an air quality sensor as part of our real-time atmospheric telemetry. You can view it’s 10 minute average Air Quality Index (AQI) at marquette.purpleair.com.

Given our proximity to vast tracts of unspoiled wilderness, especially to our north in Canada, we want to be prepared if there are plumes of air from forest fires that invade Marquette similar to NYC/DC this past week!

We are still in the testing phases of this device. Once it appears to be reliable & accurate we may publish the AQI reading in the “Weather Conditions” section of the home page (CITY).

UPDATE 06/12/23 10:30 PM:

Air Quality readings are now available on our home page! I have included range information (0-500) for this reading and a couple others too. You can now click on any header in the Weather Conditions section and it will give you a “tooltip” explaining that measurement. I see this as a great way to educate visitors and enhance engagement with the site.


Here Comes The Sun

You might have noticed a couple new readings in the “Current Conditions” section of our home page. I’ve installed 2 new sensors on our main weather station, a Davis Vantage Pro2, to measure output from the Sun.

One sensor reads a narrow band of ultraviolet (UV) radiation. The 290 – 390 nm spectrum of the sun’s shortwave energy particularly affects human health. Readings are translated into a universal UV index (1 – 16 scale).

The other sensor measures broad spectrum solar radiation (a.k.a. “solar irradiance”, “solar insolation”) between 300 – 1100 nm. It’s output scale is 0 – 1800 Watts per meter squared (W/m2). This is useful for solar energy management & approximating cloud cover / ambient light. You may wonder “can’t I just look out a window?” If you are in Marquette, yes. If you are elsewhere, no.

Continue reading “Here Comes The Sun”

Instrument Calibrations

As noted in the about page, I regularly check our sensors to be sure they are within specifications. Over the last couple weeks I have been conducting tests.

Temperature was right on. That’s typical, as our sensor is pretty bulletproof. I have a platinum RTD digital thermometer that’s accurate to within 0.1° F (best to check on a cloudy, windy night to eliminate radiation as a factor). I also have a laboratory-grade aspirated psychrometer with a dry bulb thermometer that’s extremely accurate. It’s analog, so the biggest challenge is reading between the lines. But my tests show the station’s thermal sensor is within 0.5° during the day which is quite good. There’s also a backup sensor on site as well. At night or on cloudy/rainy days, the two sensors are normally within 0.2° F. During sunny days, height (7 ft vs 21 ft) and shielding differences (active vs passive ventilation) can frequently lead to 1° differences in either direction. 2-3° differences are not out of the question when it’s particularly calm and sunny.

Continue reading “Instrument Calibrations”

Website is Now in Summer Mode

Usually I wait until May 1st, but the upcoming 7-day forecast shows temperatures almost entirely above freezing with daily highs in the 40s & 50s. Some rain is possible next week. This is not what I would describe as “wintry” by U.P. standards. Since the site only has two modes, I think it’s time for “summer” mode.

This means that wind chill will no longer display in the current conditions on the City page (home page). Rain measurement will take its place to the right of temperature. However, until April 30th, you can monitor hourly wind chill via the daily table on the Weather History page.

Keep in mind that for wind chill to be calculated the temperature must be under 46° and the average wind speed must be at least 3 mph. Otherwise, the wind chill is the same as the ambient temperature. In actuality, wind chill remains very close to (if not identical to) the air temperature until the latter drops into the 20s and/or there are very strong winds.

If we get another cold spell this spring, I will return the site to winter mode temporarily. Let’s hope that’s not necessary!

****

P.S. If it snows in the next 7 days, it’s officially my fault.

***

UPDATE 5/9/2020: The website is temporarily back in winter mode due to the recent snowfall and cold temperatures. I anticipate by Tuesday the 12th I can return it to summer mode for good (knock wood).

Freezing Drizzle AND Snow?

You may wonder, “How can it snow & drizzle at the same time?”

Short answer: when clouds aren’t cold enough to produce snow (exclusively or at all) drizzle can form.

Longer answer: If the air is sufficiently cold and wet, only snowfall is possible. But when precipitating cloud top temperatures are above -10° C (14° F) but still below freezing, the ice nucleation process requires help. Unstable, rising air can induce the formation of snowfall. Failing that, with only slightly below freezing temperatures, snow crystallization needs smoke, dust, pollution or any other tiny airborne surface upon which to bond. Otherwise precipitation can fall as drizzle/mist.

Why today? We’ve had a shallow layer of moist, sub-freezing air (< 5,000 ft) “capped” by warmer, drier air above since Sunday evening (1/26/20). Cloud tops have been just below -10° C. The moist air from sublimating snow/ice and weak low pressure has combined with onshore, upslope winds to induce some lift in the lower atmosphere. This, along with whatever particulates were aloft, produced snowfall. The remaining moisture has fallen as drizzle which froze upon contact depending on the surface composition. Most surfaces weren’t cold enough to allow much, if any, ice accumulation. A light glaze has been observed in places around our property — just enough to increase stopping distances on untreated pavement.

Normally this time of year clouds are much colder. But we have been running well above normal throughout the atmosphere recently. That’s why we’ve had several wet snow events in December & January.

Back to Top
Theme:

(Auto night: 9:06 PM - 6:47 AM)