Blog

2024 Air Quality Index (AQI) Update

2024 AQI Revisions
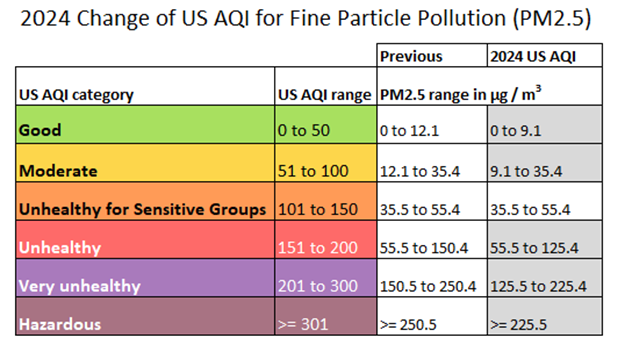
Image courtesy of IQAir

On May 6th the U.S. Environmental Protection Agency rolled out a change to the Air Quality Index (see table above). We didn’t receive notification of this until yesterday. These modifications are now live on the website — both in current conditions and in the weather history tables effective July 19, 2024.

Keep in mind, we apply an EPA correction factor to the AQI reading. If you visit other air quality websites or apps, the readings may seem incorrect if, by default, they report raw AQI. The most accurate way to compare our sensor readings to others nearby is to visit https://fire.airnow.gov/. Click the search icon, type in “Marquette, MI” and hit enter.

Why do we correct the AQI? Because researchers at the EPA discovered that by applying an algorithm to our “low-cost” (~$400) PurpleAir sensor its readings better approximate the higher-cost, more accurate government sensor readings. Experiments were conducted within the context of wildfire smoke pollution — the thing people are most concerned about here.

It Ain’t Broke If You Don’t Know

My apologies to those who endured stale data on the home page almanac & weather history page on Friday & Saturday. The app that uploads data from our weather telemetry to the website (hosted downstate) had inexplicably stopped. It wasn’t locked up. It just wasn’t running the schedule. I could manually update, but not automatically. A restart of the app solved the issue. I’ve used that utility for years now and never seen anything like that. My thanks to a regular site visitor, Julie, who alerted me and sent me a kind note to boot! Please do not hesitate to use the contact form if you notice something is awry.

Fortunately, I have multiple, independent systems so when one fails, the others continue. For example, conditions data is uploaded every 3 seconds by two different apps. Forecasts are downloaded directly by the web server (and I can switch to a back up process when the provider is down). Even if we lose power at our property, the forecasts and alerts will continue to update indefinitely.

I am constantly checking for and fixing bugs — both in my own code and those generated by our various providers. Between our regular visitors, my wife and my own (normally) keen eye no error on the site goes undetected for long.

Earlier in the week you may have noticed missing forecast icons. That was due to a couple unpublished changes NOAA (parent organization to the National Weather Service) pushed out to their forecast API. Upon investigation I saw that they had started to omit the domain (!) from the image URLs. So I had to prepend the domain to all their file locations. Also they started sending an empty data field for wind direction when the speed is 0. If you know anything about programming, the first error routine is to check for empty data and reject it because all valid data must have a value. Not in this case! So I manually force a “N” (northerly) wind direction which was the default they had been supplying in that case for years. Once I realized this wasn’t just a temporary goof on NOAA’s part (which has happened multiple times and self corrects within an hour or so), I ultimately switched over to a “legacy” source for forecast data for a time until I could make updates to the affected forecast files.

My philosophy is that the user interface — the portion of the website the visitor sees and interacts with — should be simple & dependable not trendy. No infinitely scrolling pages which stutter and lock up while you search for the information you need! No bloated multi-megabyte pages that track you and interrupt you with pop ups while you’re trying to read.

Behind the scenes of this seemingly modest (perhaps even “old-fashioned”) website are tens of thousands of lines of code written by yours truly. The weather history page alone is a complex series of mathematical calculations (using standard equations that have been accepted for decades). Everything has been quadruple checked for accuracy against other sources.

We are about to step into our 10th year of recording data just south of downtown Marquette. The aim is to provide a long-term, independent, reliable source of weather data completely free and available to the public.

Thank you to our many regular (and irregular — you know who you are) visitors!
Blizzard Summary 1/12-14/24

We announced late last year that we would no longer measure snowfall. Well, at least not regularly 😉

Since we still have a snow board in our observation area — and we had cleared it before it started snowing Friday — we thought we’d stick a ruler down this morning after all was said and done.

Turns out 12.0″ fell in the past 48 hours ending 10 AM Sunday morning. That corresponds to 0.85″ of melted snow (liquid equivalent) that we caught in our precipitation gauge over that period.

Now, take it with a grain of salt because it’s in a somewhat sheltered area that is prone to drifting. However, this spot is lower than some and higher than others. Seems pretty average.

The National Weather Service office in Negaunee Township, just 8 miles up the road on US-41, measured just over 2 feet in that same time period. That is likely due to their higher elevation. Other reports closer to the lakeshore support lower totals such as ours.

In the future, we may provide a storm total measurement after significant events. That’s assuming that nearby drifts don’t expand to include our snow board. That can result from plowed snow mountains up wind growing over the course of the winter.

As far as wind speeds, our max recorded gust was 35 mph out of the north yesterday morning in the 7 o’clock hour. We have good “fetch” from that direction with no obstacles within 100 feet. The U.S. Coast Guard, located near McCarty’s Cove on the lakeshore, caught a 58 mph gust in the 10 AM hour but mostly clocked upper 30s / low 40s gusts throughout Saturday morning.

New Station All-Time High

On Labor Day (9/4/23) our station recorded a maximum temperature of 95.7° which eclipsed our previous all-time high of 95.2° on June 6, 2021. We have been (unofficially) recording weather at this location since July 2015.

Our maximum heat index on Monday 9/4 was 102°. The dewpoint topped out at 72°. It was a very muggy day by Upper Michigan standards (dewpoints typically in the 40s/50s in early September).

Got a Little Rain Last Night…

Last night around 9 PM EDT, we experienced a deluge of rain during a severe thunderstorm. Our automatic tipping spoon recorded the second highest rain rate in the 8 years we’ve been online (10.7″/hr). Overall, we picked up just over 1.5″ of rain in half an hour with about 1″ falling in the first 15 minutes of the storm.

We clocked a 37 mph wind gust during the storm. However, each wind measurement must last up to 2.5 seconds to be recorded by our system. It’s quite possible higher, shorter-lived winds were present during that storm as radar had indicated up to 60 mph gusts according to the severe thunderstorm alert issued by the National Weather Service.

There was lightning aplenty but no hail. We got quite the hail storm on Saturday July 22nd. The entire property was coated with pea size pellets.

Marquette is running WELL above normal for July rainfall. So far 4.89″ has been recorded by our automatic gauge (which is checked against a manual gauge daily). Marquette’s 30-year normal rainfall for July is 2.77″.

Incidentally, the third highest rain rate in our history (9.75″/hr) was recorded less than two weeks ago on July 15th when we picked up 0.64″ for the day.

Back to Top
Theme:

(Auto night: 10:49 PM - 5:02 AM)