Blog

It Ain’t Broke If You Don’t Know

My apologies to those who endured stale data on the home page almanac & weather history page on Friday & Saturday. The app that uploads data from our weather telemetry to the website (hosted downstate) had inexplicably stopped. It wasn’t locked up. It just wasn’t running the schedule. I could manually update, but not automatically. A restart of the app solved the issue. I’ve used that utility for years now and never seen anything like that. My thanks to a regular site visitor, Julie, who alerted me and sent me a kind note to boot! Please do not hesitate to use the contact form if you notice something is awry.

Fortunately, I have multiple, independent systems so when one fails, the others continue. For example, conditions data is uploaded every 3 seconds by two different apps. Forecasts are downloaded directly by the web server (and I can switch to a back up process when the provider is down). Even if we lose power at our property, the forecasts and alerts will continue to update indefinitely.

I am constantly checking for and fixing bugs — both in my own code and those generated by our various providers. Between our regular visitors, my wife and my own (normally) keen eye no error on the site goes undetected for long.

Earlier in the week you may have noticed missing forecast icons. That was due to a couple unpublished changes NOAA (parent organization to the National Weather Service) pushed out to their forecast API. Upon investigation I saw that they had started to omit the domain (!) from the image URLs. So I had to prepend the domain to all their file locations. Also they started sending an empty data field for wind direction when the speed is 0. If you know anything about programming, the first error routine is to check for empty data and reject it because all valid data must have a value. Not in this case! So I manually force a “N” (northerly) wind direction which was the default they had been supplying in that case for years. Once I realized this wasn’t just a temporary goof on NOAA’s part (which has happened multiple times and self corrects within an hour or so), I ultimately switched over to a “legacy” source for forecast data for a time until I could make updates to the affected forecast files.

My philosophy is that the user interface — the portion of the website the visitor sees and interacts with — should be simple & dependable not trendy. No infinitely scrolling pages which stutter and lock up while you search for the information you need! No bloated multi-megabyte pages that track you and interrupt you with pop ups while you’re trying to read.

Behind the scenes of this seemingly modest (perhaps even “old-fashioned”) website are tens of thousands of lines of code written by yours truly. The weather history page alone is a complex series of mathematical calculations (using standard equations that have been accepted for decades). Everything has been quadruple checked for accuracy against other sources.

We are about to step into our 10th year of recording data just south of downtown Marquette. The aim is to provide a long-term, independent, reliable source of weather data completely free and available to the public.

Thank you to our many regular (and irregular — you know who you are) visitors!

Expanded Hourly Forecast Now Available

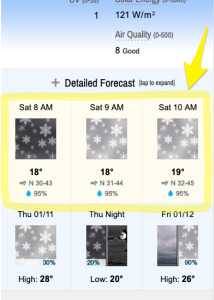
The graphical hourly forecast on the CITY page now looks ahead 48 hours (previously only 24 hours). This should be particularly helpful during long-lasting storm events.

Accuracy beyond 72 hours is lacking in hourly forecasts. 48 hours seems to be the sweet spot now in terms of accuracy and usability. Beyond that, one is forced to scroll through endless tiles looking at information that is going to change significantly in the next 12-24 hours.

The hourly (yellow) & daily (light blue) forecasts are scrollable on mobile devices, trackpads, and mice. On touchscreens, just swiping left will allow you to scroll into the future. On Mac trackpads — same thing — use 2 fingers and swipe left over forecast icons. On PCs and desktop Macs, you need to position the cursor over the forecast tiles and then hit shift and use the mousewheel (scroll up to go forward in time and down to go backward). You can also navigate using a keyboard by pressing tab, then return/enter (to skip the navigation and go straight to the content area), and then press tab repeatedly until it highlights the hourly forecast area. Then you can use the directional arrows.

Spoiler: Christmas Will Be White & Windy

Updated: Tuesday 12/20/22 11:25 AM

Expect high winds & significant snowfall in the days leading up to Christmas (Fri/Sat).

It’s still too early to discuss exact amounts of snow or top wind speeds. Have the shovels, snowblowers and/or generators ready though.

Decent snowfall likely late Wednesday & throughout Thursday before main event on Fri/Sat.

As of 11:25 AM Tuesday, max winds should occur Friday afternoon thru early Saturday morning. If power should fail, buildings without a backup source of power or heat will cool quickly as temperatures slide into the teens or colder.

Continue reading “Spoiler: Christmas Will Be White & Windy”

NEW! Dual Forecast Display: Hourly + Daily

The City page (home page) now features concurrent hourly & daily graphical forecasts. Previously, you had to select one or the other. We thought it would be helpful to see all that information in a glance rather than forcing visitors to make a choice.

For what it’s worth, your site operators — my wife and I — think this is a big improvement.

For those who don’t enjoy the change, however, you can visit page settings (gear icon in upper right of home page) and select which forecast, if any, you wish to see. You’ll find those options under the heading “Graphical Forecast”. Your preference will be saved as a cookie stored on your device for future visits.

PRO TIP: Since all horizontal scroll bars have been removed (because… ugly!) from the graphical forecast, those who are using a keyboard and mouse only (not a laptop trackpad or mobile device) can see additional forecast icons by clicking on the forecast you wish to scroll and using the right and left arrows on the keyboard. Those on mobile computing devices can continue using the screen (phones/tablets) or trackpad (Macs confirmed; others?) to scroll forecast icons as before. You will find up to 24 icons in the hourly forecast and 13 icons in the daily forecast.

New Hourly Forecast Feature

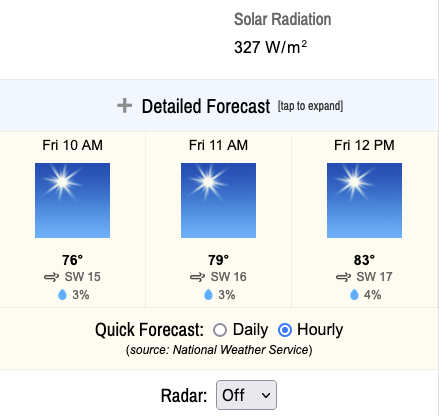
hourly forecast as seen on iPhoneAs of today, an hourly forecast from the National Weather Service is now available on the home page. Simply locate the horizontal row of weather icons and look immediately beneath them. You will see a section header: “Quick Forecast”. There you can select either “daily” or “hourly”. Your device should remember your selection over time (assuming you haven’t disabled “cookies”).

This new feature will allow you to see the next 24 hours in terms of temperature, wind, sky conditions and probability of precipitation. You can easily scroll with a finger (mobile) or trackpad (laptop) to see all available hours.

Also, for our “power” users, if you visit page settings on the home page (see gear icon in upper right), there is an option to enable dewpoints on the hourly forecast. This is quite useful in the summer to determine how “muggy” any given day will feel. The general rule of thumb is it starts to feel humid when dewpoints rise to the low 60s or greater. Once it hits 70° (only maybe a few times per summer in Marquette, generally), it’s quite humid. In the winter, when the dewpoint and the temperature begin converging, the likelihood of snow goes up. So there is value to this reading year round.

We hope you enjoy this new feature. Let us know what you think in the comments below.

Back to Top
Theme:

(Auto night: 9:13 PM - 6:18 AM)