Blog

Hazardous AQI Due to Neighbor Burning Trash

Just a note…

If you are curious why we experienced an AQI (Air Quality Index) over 400 during the lunch hour it’s because my neighbor was burning trash. Otherwise, the air quality has been good to moderate today.

Researchers sometimes come to the site and examine the Weather History for a given day — sometimes years afterward — and might furrow their brow at such an extreme outlier not recorded by any other nearby station. Hopefully they find this blog post.

Mobile Devices Now Have Bottom Navigation

Mobile view with navigation icon
“Off canvas” navigation in a mobile viewport

Previously, if you wished to navigate the website in a mobile device you needed to go (back) up to the top left navigation menu. As of today, if you have scrolled to the bottom of the page, you can simply access the navigation in the footer. This has always been the case for those using PCs & Macs.

New footer navigation as seen in a mobile browser

I had struggled to preserve the navigation in smaller viewports without it appearing cramped in that space… until now. I will leave the “Back to Top” links in place for those who want a quick way to start over from the top of the page.

Also I have added a light blue background color to distinguish this section from surrounding content. In night mode, the footer will turn to a deep navy.

As always, the site is completely responsive which means you can view it on any modern device with the screen size/orientation of your choice. You can even put it in a small browser window when using a computer alongside your other app(s). Home page conditions will update every minute by default and the entire page will refresh every 10 minutes.

I invite you to make full use of the site. Each page is a collection of freely-available, unique resources not found in one space elsewhere.

As it stands we have decent site engagement. That said, plenty of folks — even longtime regular users — have never left the home page. I assure you, we don’t put filler pages on the site. It’s all useful!

Improved Humidity Algorithm

We’ve noticed for awhile that the top value for humidity readings seems to be in the low to mid 90 percentiles (in unadjusted raw values). The humidity sensor’s effective ceiling has dropped since we last performed a significant top-end adjustment in 2020.

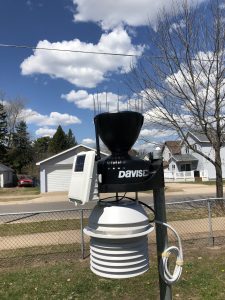
Perhaps you’re thinking, “why not just replace the sensor?” Because a new sensor, while perfectly affordable and somewhat more accurate in very moist air, has other more unpredictable errors which will not be easily correctable. I base this assertion upon years of experience with the SHT31 sensors, particularly when exposed to fan-assisted air movement (~2.25 m/s). A replacement sensor need to “harden” in the field for years before being deployed. We’ve had one “baking” in our backup station since last fall, and it’s not ready yet. It’s only to be used in the event of a failure of the primary station.

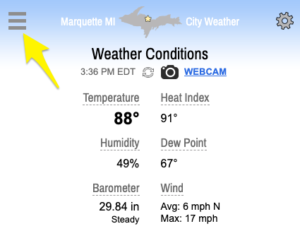
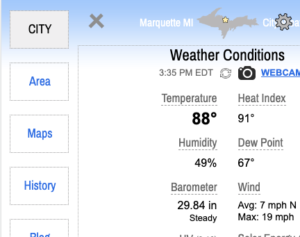
In the early morning hours of Monday July 24th our location experienced significant dewfall. Dew coated all objects within view, including the housing of our weather station. Unfortunately, our station’s max humidity reading that morning was 91%. Not good. A fan-aspirated weather station, such as ours, will sometimes run a bit drier than nearby air-ventilated stations which are susceptible to moisture depositing within their housing & on sensors when winds are low but air is not quite saturated (95-100% RH).  But given the level of moisture observed combined with empty radar images & precipitation gauges, our sensor should have read upper 90 percentiles at least, with or without a fan to move air through the housing. Other nearby weather stations were reporting maximum humidities for hours, including our backup station.

After hunting through humidity records this past year and observing patterns, I have tweaked the “dry bias” algorithm that progressively adjusts readings above 85% relative humidity. It’s a bit tricky because the sensor also has a “wet bias” that stretches into the low 80 percentiles. Certain values have to be transitioned to make the handoff at 85 smooth yet accurate. Luckily, I’ve got lots of data available from past and present checks against our reference psychrometer (accurate to +/- 1% RH) to aid in the process.

You should now clearly notice when fog, dew or significant precipitation events occur just by examining humidity tables on our weather history page. Future maximum values should be close to, if not precisely, 100%.

Questions? Thoughts? Hit the comment form below.

****

UPDATE 7/27/23 2:55 PM: Fog descended on Marquette last night! It lasted for several hours. A decent rain storm followed this morning which re-saturated the air with moisture (nearby stations all at max humidity). The new algorithm couldn’t have performed better!!

Real-time Air Quality Monitoring Now Available

We have acquired & installed an air quality sensor as part of our real-time atmospheric telemetry. You can view it’s 10 minute average Air Quality Index (AQI) at marquette.purpleair.com.

Given our proximity to vast tracts of unspoiled wilderness, especially to our north in Canada, we want to be prepared if there are plumes of air from forest fires that invade Marquette similar to NYC/DC this past week!

We are still in the testing phases of this device. Once it appears to be reliable & accurate we may publish the AQI reading in the “Weather Conditions” section of the home page (CITY).

UPDATE 06/12/23 10:30 PM:

Air Quality readings are now available on our home page! I have included range information (0-500) for this reading and a couple others too. You can now click on any header in the Weather Conditions section and it will give you a “tooltip” explaining that measurement. I see this as a great way to educate visitors and enhance engagement with the site.


A Slight Change To The Almanac

Perhaps you’ve noticed the field “Monthly Departure” in the Almanac on the City page (home page)? Its value represents the current aberration from the 30-year normal average temperature for the calendar month.

Previously, this field was being calculated on a month-to-date basis. That meant that if, for example, only 2 days had passed in the month, and those first two days were very hot or very cold, then the departure value would be quite large (either negatively or positively).

As of today we are calculating the departure as a full month preloaded with normal average temperatures. We replace each day’s normal average temperature with an observed daily average temperature as it occurs. This results in much smaller departures earlier in the month.

We feel this updated methodology is a more accurate representation of reality where trends emerge gradually. Climate, by definition, is the general tendency of observed phenomena — in this case temperatures — to occur within certain boundaries over a long-term period. A few days, or even a week, does not determine the outcome of an entire month.

So, to demonstrate…. The first 4.5 days of June 2023 have been unseasonably warm and yet have only resulted in a +1.4° departure (which rounds down to +1°) for the month. We are no longer assuming there will not be 25 days to come. Instead, we put in normals for those remaining days and witness how much our recent weather skews the entire month.

A couple hundred lines of code have gone into this single field (“Monthly Departure”) in the Almanac. This is the sort of thing that sets this website apart from other weather sources.

Back to Top
Theme:

(Auto night: 9:21 PM - 6:26 AM)