Yesterday, November 13th, the high was 21 (both here and at the official COOP station). The coldest high temperature on record for that day in Marquette was 20 set most recently in 1919 (tied with 1883 & 1900).
 We’ve recorded 5 days in row with lows in the teens! Normal lows this time of year in the city are around 30. Normal highs are in the low 40s. So far we are running more than 6 degrees below normal for the first 14 days of November. That follows a cold October.
If the forecast holds, it looks like there will be a slight bump in temps today, tomorrow, and Friday, although still not quite “normal”. Then we drop right back into well below normal temps for the weekend and the beginning of next week.
The Trend for 2018?
It’s been an up and down year so far, but we are all but guaranteed to end the year below normal — barring a record setting December.* The question is by how much?
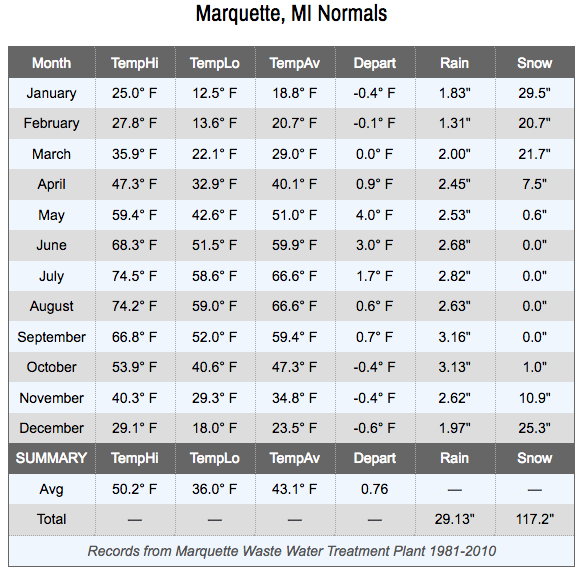
Let’s put this into the context of the past few years. In 2017 the yearly average temperature was 43.5 (when data is adjusted to match the same period of observation employed by the COOP station). That’s almost half a degree below normal.** 2016 was about 1.4 degrees above normal. We don’t have a complete data set for 2015; however, the official station reported 0.7 degrees below normal that year. Assuming our current trend of -6.1 degrees holds for November and December is completely normal, we would end 2018 about 1.7 degrees below normal. To end 2018 above normal would require November to completely erase it’s 6 degree deficit in the remaining 14 full days followed by a December that was 14+ degrees above normal!
—-
NOTES:
* An earlier version of this article incorrectly stated that we were likely to end 2018 well below normal for the year (-3.5 degrees potentially). After discovering an error in the supporting math, I have softened the prediction. Additionally, I have revised the calculation method to match the measurement period of the official COOP station (an observation period of 8AM – 8AM in which each month starts and ends at 8AM the last day of the month). Note that the average temperatures reported in the yearly table on our weather history page are calculated by calendar days and months. We can do that since our station is automated. Whereas the COOP station has manually observed daily temperatures once per day using a minimum-maximum thermometer (in the mornings since about 1960 and in the afternoons before that) for over 140 years!
** First we take the normal yearly average temperature over the last 30 years as measured at the the official weather station for Marquette (located at the Water Filtration Plant on Lakeshore Blvd), which is 43.1. Then we determined the average difference between our station and the official station for every month of the year since August 2015 (listed in our weather history “normals” table under the “Depart” heading). That averages out to +0.76F. Or, put simply, 43.1 + 0.76 = 43.86 which rounds to 43.9. This preliminary number will improve over time as we collect more data.